Hottest HoReCa Regions in Europe Are Not What You Would Think


.png)
As a HoReCa expert, you might know the most profitable region of today. But can you predict which one it is gonna be tomorrow? In other words, can you tell where most of the growth is happening at this exact moment? Where are all the cool bars and new-concept restaurants emerging?
Well, we can. Thanks to Outlet Census Live and its HoReCa Growth Segment indicator. With it, anyone can find the growth champions of HoReCa market and find all the data needed for closing a deal. Why is this useful?
- You can create lead lists in minutes
- You can spread your resources effectively
- You can predict where future pockets of opportunities will emerge
To demonstrate this we have glanced over Europe and found the hottest regions for 20 selected countries. Can you guess them ? Try it before you start reading. Sometimes, data shows us the bias of our own experience.
ACCESS OUTLET CENSUS LIVE DEMO HERE
How Do We Measure Growth in HoReCa?
The Growth Segment indicator in Outlet Census Live captures the future potential of a HoReCa outlet. It ranks it against all outlets in the market based on the growth in their aggregated consumer engagement calculated relative to 3 months ago across all platforms (Facebook, Instagram, Tripadvisor, Google Places, Booking.com) and engagement types (likes, reviews, follow, posts).
As engagement usually correlates with footfall quite accurately, it basically tells you if the outlet is getting more customers or if it’s stagnating. By the way, stagnation doesn’t have to be a bad thing - it simply means the outlet has reached its peak and might still be pretty profitable for you already.
We distinguish HoReCa outlets like restaurants, bars, cafés etc. into 5 growth ranks:
Champion: An outlet with already top engagement that keeps growing
- Rising Star: A smaller or newer outlet that is experiencing a high growth
- Laggard: An already established outlet with slower growth
- Average: An outlet with unimpressive engagement and growth
- Inconclusive: Not enough data to make a clear decision
This article is looking primarily at a percentage of Growth Champions amongst regions in selected countries to determine which ones have the largest share of fast-growing outlets. That, in turn, will tell us which of these regions are the hottest HoReCa regions of today.
See Also: Fun With Bun: Europe’s Juiciest Burger Markets
Quick Facts (if you’re busy)
- Capital cities rule in half of the analyzed countries but really struggle in the rest of them, e. g. Paris is 10th in France and has 55.7% less Champion concentration than the hottest HoReCa region of France
- The capital cities tend to struggle more in southern Europe but not exclusively
- The leading regions fall into 3 categories: capital cities, tourist regions and border regions
- There are wide differences in % Growth Champion share among the picked countries
See Also: Most Popular Cocktails of Europe
The Realm of HoReCa Champions
In order not to be too long and tedious, we have selected 16 countries to look at: 4 from each part of Europe. So we have…
France, Belgium, United Kingdom and Ireland for Western Europe
- Germany, Czechia, Austria and Poland for Central/Eastern Europe
- Spain, Italy, Portugal and Greece for Southern Europe
- Sweden, Norway, Finland and Denmark for Northern Europe
Let’s dive straight into the data. Below you will see a table with each country, their fastest-growing region and the % share of Growth Champion outlets on their overall market. Also included is a note whether the region contains the country capital or not.
Keep in mind that the average % share of champions in all countries we track (39 at the moment) and across all HoReCa outlet types is 13 % - you can clearly see in the table below that all the top-growing regions are above this average and some much more than others.

Now let’s analyze some peculiarities.
Champion Concentration Differences
The first thing that strikes us as interesting is the difference between some of the countries.
For example, Greece’s Notio Aigaio (Southern Aegean region) and UK’s West London have 24.28% and 23.12% concentration respectively. While Norway’s Vestlanded or Denmark’s Hovedstaden have just 15.06% and 15.78% respectively.
That means that Notio Aigaio has 61.2% higher HoReCa Growth Champions outlet concentration than Vestlanded. A stunning difference even though the Aegean islands are generally quite popular touristic destinations so their lead is no surprise.
Generally speaking, northern Europe leading regions have lower concentration of Growth Champions which likely reflects the diminished role of HoReCa in the chilly weather as opposed to the rest of Europe.
The Winning Formula For the HoReCa Channel
If you look closely at all the winning regions, you will see they mostly fall into 3 categories:
- The capital city - 8 out of 16
- A tourist region - 12 out of 16
- A region bordering other countries - 6 out of 16
The pattern is clear: The fastest growing regions usually benefit from people mobility, capital city concentration or cross-border cooperation and tourism.
Read More: The Three Vodka Giants of Europe
The Capital Question
What’s also interesting is the fact that just half of the analyzed countries’ capitals made it to no. 1 spot. What’s even more surprising is how far behind the leading pack these capital cities are.
Take France, for example. Paris ended up 10th with 13.96% concentration vs Languedoc-Roussillon with 21.73%. That's a 55.7% difference! But the pattern is similar elsewhere as well:
- Italy: Lazio (14.62%) vs Trento (19.24%)
- Spain: Madrid (13.68%) vs Illes Balears (21.83%)
- Belgium: Brussels (15.68%) vs Namur (21.16%)
- Poland: Warsaw (14.61%) vs Dolnośląskie (18.42%)
And the list goes on.
In southern Europe, the answer to this puzzle is clear - most tourists visit primarily tourist destinations which are often not anywhere near the capital. In the case of France, Belgium and Poland, all the top-growth regions are bordering another (usually very developed) country.
And if we look really closely at the Vestlanded region of Norway, we see a similar pattern. The city of Bergen is Norway’s most busiest port in terms of both cargo and passengers, there are over 300 cruise ship calls per year (half of the passengers are German or British) and the city itself is known as the gateway to Norway’s famous fjords. So even though Vestlanden might not strike you as a tourist region at the first sight, it actually is.
The Average Difference
Last but not least, let’s look at the overall average % share of HoReCa Growth Champions among all the countries to see if there are any notable differences.
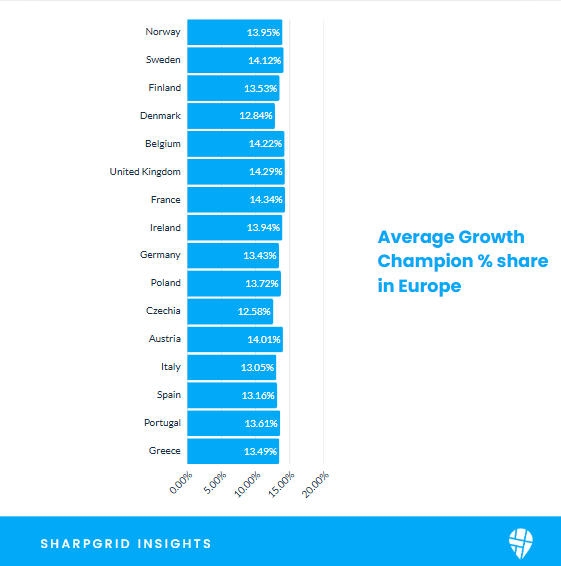
As you can see, the differences are almost negligible. This tells us that even though the overall numbers are similar, the distribution of Growth Champions amongst specific regions can be quite uneven and it is always important for a HoReCa market player to know where to look for opportunities.
How To Capture Growth in the HoReCa Channel
Capturing growth trends is crucial for any company that wants to do serious business and stay relevant in the ever changing HoReCa channel. Luckily, you don’t have to rely on tedious manual data collection and work anymore.
Outlet Census Live is a live database updated on a monthly basis with advanced filtering systems for creating hyper-relevant lead lists and outlet profiles with crucial information needed for successful negotiations. If you’re interested, pick a date for your free demo now. We’ll be happy to show you around.